Design Page 機能を利用したレポートの作成
公開日:2015/04/27
Shotgun ではページを別名保存して自分好みのレポートを作成することが可能です。
Shotgun の良い所は別名保存した複製元と複製先のデータが正しく連動していることです。複製先でのステータス変更は、複製元にちゃんと反映されるのでデータの整合性が保たれます。
今回は、ショットやアセットの総数を表示するレポートページを作っていきます。
ショットのページ開いてカスタマイズして行きたいと思います。
ョットページを基準にして別ページとして保存します。
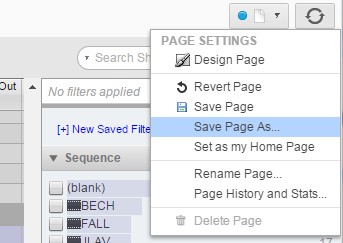
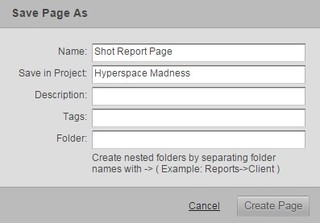
Name に名前を入力してCreate Page を実行します。
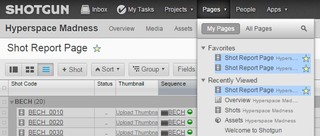
これにより、異なるURLの新しいページが生成されました。
ページ名の右横の★マークをクリックすると、いつでもPagesのお気に入りからアクセス出来ます。
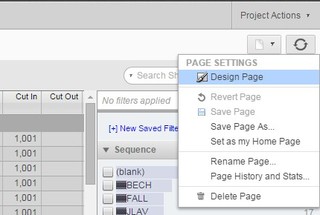
先ほどと同じ場所から今度は Design Page を選択します。
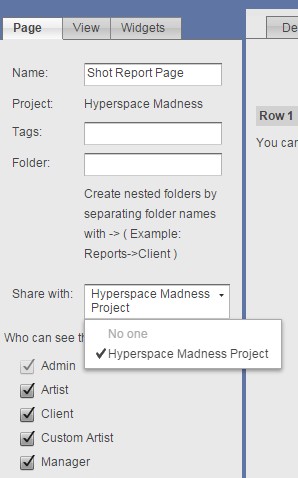
表示されたページの左側では以下の変更も行えます。

Share with: このページをどのプロジェクトのメンバーと共有するか指定できます。 No One を選択すると自分だけが閲覧出来るプライベートページになります。

これにより、異なるURLの新しいページが生成されました。
ページ名の右横の★マークをクリックすると、いつでもPagesのお気に入りからアクセス出来ます。
先ほどと同じ場所から今度は Design Page を選択します。

表示されたページの左側では以下の変更も行えます。
Share with: このページをどのプロジェクトのメンバーと共有するか指定できます。 No One を選択すると自分だけが閲覧出来るプライベートページになります。
Who can see this page: どの Permission Group のユーザーに閲覧させるかを指定出来ます。
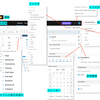
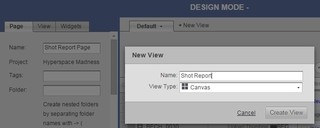
つづいて、 + New View という箇所をクリックします。
タブに対する名前をつけましょう。
View Type では Canvas を選択します。
続いて、左欄の View というタブをクリックします。
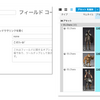
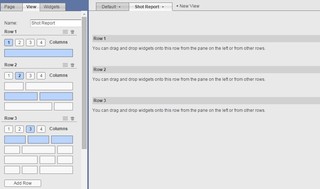
ここでは、パーツを埋め込むためのレイアウトを指定していきます。
必要に応じたコラム数と間隔を選択し、 Add Row ボタンで追加します。
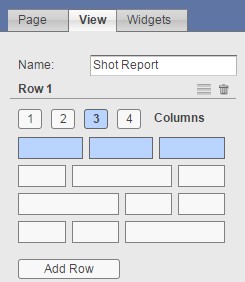
こんな感じの配置にしてみました。
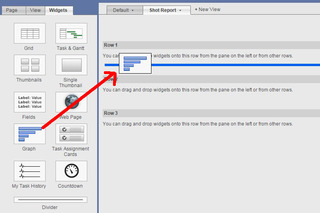
次に Widgets というタブをクリックします。
Graphウィジェットを掴んでドラッグ&ドロップで配置します。
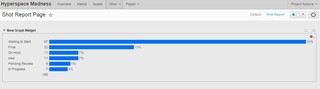
今回は、Shot のステータスを表示させたいので、Shotを指定して Configure の文字をクリックします。
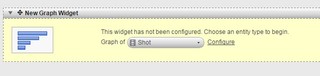
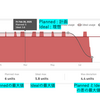
すると、特に何も変更しなくても Shotに関するステータスのグラフが表示されます。
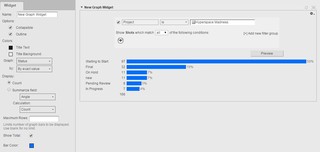
必要に応じてカスタマイズを行なってください。
合計のショット数を表示するには Show Total にもチェックを入れておきましょう。
ウィジェットのプレビュー状況に問題がなければ、右上の Save ボタンで保存します。
Design Mode を抜けてページ自体を保存するにはもう一度右上の Save ボタンで保存する必要があります。
すると、このようにタブ切り替え型のオリジナルレポートページが作成できました。
Design Mode に戻って、その他のウィジェットの機能もお試しください。